1k Brain Nuclei from an E18 Mouse
Nuclei from a combined cortex, hippocampus and sub ventricular zone of an E18 mouse.
CellRanger Metadata
PreviewPreview the Web Summary produced by CellRanger here.
| Accession | Estimated No. of Cells | Mean Reads per Cell | Median Genes per Cell | No. of Reads | % Valid Barcodes | % sequencing Saturation | % Q30 Bases in Barcode | % Q30 Bases in UMI | % Reads Mapped to Genome | % Reads Mapped Confidently to Genome | % Reads Mapped Confidently to Intergenic Regions | % Reads Mapped Confidently to Intronic Regions | % Reads Mapped Confidently to Exonic Regions | % Reads Mapped Confidently to Transcriptome | % Reads Mapped Antisense to Gene | % Fraction Reads in Cells | Total Genes Detected | Median UMI Counts Per Cell |
|---|---|---|---|---|---|---|---|---|---|---|---|---|---|---|---|---|---|---|
| 1442 | 36619 | 2240 | 52805264 | 98.1 | 57.7 | 97.3 | 97.7 | 94.1 | 90.1 | 2.7 | 20.4 | 67.0 | 63.8 | 1.4 | 86.1 | 16849 | 5836 |
Top 10 Marker Genes per Cluster
Download| Accession | Seurat Cluster | Gene Symbol | P Value | Average Log | Pct 1 | Pct 2 | Adjusted P Value |
|---|---|---|---|---|---|---|---|
| 0 | Gria2 | 2.91235295127374e-59 | 1.8381676320416 | 0.891 | 0.61 | 9.04372961959034e-55 | |
| 0 | Neurod2 | 2.22235152132022e-42 | 1.16656777439504 | 0.862 | 0.552 | 6.90106817915567e-38 | |
| 0 | Vim | 8.64386336195471e-33 | -2.58676024747679 | 0.152 | 0.536 | 2.6841788897878e-28 | |
| 0 | Neurod6 | 4.70728630194881e-32 | 0.965127535075659 | 0.873 | 0.567 | 1.46175361534416e-27 | |
| 0 | Pou3f2 | 4.71810639538944e-30 | 1.20109759707824 | 0.667 | 0.412 | 1.46511357896028e-25 | |
| 0 | Dbi | 1.45776058896885e-22 | -2.60050113146087 | 0.446 | 0.72 | 4.52678395692496e-18 | |
| 0 | Sox2 | 2.29242356199918e-20 | -0.77407416966313 | 0.018 | 0.281 | 7.11866288707607e-16 | |
| 0 | Phgdh | 5.14325472769791e-20 | -1.42096228147901 | 0.018 | 0.275 | 1.59713489059203e-15 | |
| 0 | Ezr | 9.34681592184937e-20 | -0.880986221751528 | 0.152 | 0.449 | 2.90246674821188e-15 | |
| 0 | Ndrg2 | 1.66761404104909e-19 | -1.01431707814063 | 0.062 | 0.335 | 5.17844188166974e-15 | |
| 1 | Aldoc | 2.40765936534606e-166 | 3.15808790180369 | 0.753 | 0.059 | 7.47650462720913e-162 | |
| 1 | Phgdh | 2.56604860822856e-148 | 2.66650495384977 | 0.771 | 0.098 | 7.96835074313214e-144 | |
| 1 | Mt3 | 5.39709767932182e-137 | 3.79743997981537 | 0.855 | 0.215 | 1.6759607423598e-132 | |
| 1 | Ddah1 | 5.40588702957416e-135 | 2.61145161629942 | 0.742 | 0.102 | 1.67869009929366e-130 | |
| 1 | Mfge8 | 9.30542212449336e-135 | 2.34846484753402 | 0.647 | 0.051 | 2.88961273231892e-130 | |
| 1 | Dbi | 7.281295526523e-133 | 3.71733402942854 | 0.982 | 0.593 | 2.26106069985119e-128 | |
| 1 | Sparc | 9.44844979680382e-133 | 2.33810741518222 | 0.571 | 0.025 | 2.93402711540149e-128 | |
| 1 | Vim | 7.86942971476919e-132 | 3.30828814407559 | 0.931 | 0.352 | 2.44369400932728e-127 | |
| 1 | Hes1 | 9.08793794962001e-125 | 2.1204486374582 | 0.553 | 0.029 | 2.8220773714955e-120 | |
| 1 | Fabp7 | 1.11984403201447e-118 | 4.91544356328212 | 0.935 | 0.505 | 3.47745167261452e-114 | |
| 2 | Ntm | 1.21887796510106e-113 | 1.54042000202989 | 0.884 | 0.204 | 3.78498174502833e-109 | |
| 2 | Opcml | 1.63076270592297e-94 | 1.9758926288956 | 0.742 | 0.163 | 5.06400743070261e-90 | |
| 2 | Cntn2 | 3.81449463024186e-87 | 1.33040121201955 | 0.936 | 0.311 | 1.184515017529e-82 | |
| 2 | Islr2 | 2.39135099509914e-77 | 1.24595868994024 | 0.734 | 0.178 | 7.42586224508137e-73 | |
| 2 | Dab1 | 4.40183008802899e-75 | 1.17445647540951 | 0.745 | 0.21 | 1.36690029723564e-70 | |
| 2 | Syt4 | 3.47525140353342e-73 | 1.15612239715537 | 0.783 | 0.231 | 1.07916981833923e-68 | |
| 2 | Uchl1 | 7.62000790939748e-71 | 1.15134433621575 | 0.996 | 0.721 | 2.3662410561052e-66 | |
| 2 | Gabra2 | 6.23237030151643e-69 | 1.07473468795527 | 0.757 | 0.22 | 1.9353379497299e-64 | |
| 2 | Nrp1 | 4.61821126050848e-67 | 1.1304864640293 | 0.921 | 0.365 | 1.4340931427257e-62 | |
| 2 | Runx1t1 | 3.31158141018056e-66 | 0.959121347367305 | 0.715 | 0.178 | 1.02834537530337e-61 | |
| 3 | Mfap4 | 3.91356184475577e-77 | 1.47611760424456 | 0.758 | 0.188 | 1.21527835965201e-72 | |
| 3 | Eomes | 7.87387667316799e-69 | 1.75698664415891 | 0.616 | 0.129 | 2.44507492331886e-64 | |
| 3 | Sstr2 | 8.69127417661553e-69 | 1.42056084089647 | 0.749 | 0.22 | 2.69890137006442e-64 | |
| 3 | Rnd2 | 6.07535570212651e-65 | 1.39403507477729 | 0.782 | 0.261 | 1.88658020618134e-60 | |
| 3 | Mfng | 4.67407649131608e-60 | 1.18189155696722 | 0.64 | 0.161 | 1.45144097284838e-55 | |
| 3 | Ezr | 2.6741056261967e-54 | 1.21822030463334 | 0.815 | 0.319 | 8.30390020102861e-50 | |
| 3 | Pcp4 | 2.34481703597005e-48 | 1.65150843830018 | 0.659 | 0.218 | 7.28136034179779e-44 | |
| 3 | Mdk | 3.74640523238361e-46 | 1.32551433551689 | 0.919 | 0.58 | 1.16337121681208e-41 | |
| 3 | Igsf8 | 1.99725311290092e-42 | 1.05341618927006 | 0.825 | 0.417 | 6.20207009149123e-38 | |
| 3 | Cdk2ap1 | 2.91878984517314e-39 | 0.905202602314877 | 0.787 | 0.374 | 9.06371810621614e-35 | |
| 4 | Nrxn3 | 1.57097275314305e-209 | 3.34813641815467 | 0.859 | 0.033 | 4.87834169033512e-205 | |
| 4 | Dlx2 | 5.27211262076286e-159 | 2.16881217055804 | 0.588 | 0.008 | 1.63714913212549e-154 | |
| 4 | Gad2 | 3.72158490566113e-157 | 2.40103157097575 | 0.647 | 0.02 | 1.15566376075495e-152 | |
| 4 | Maf | 1.4635963167629e-135 | 2.65775906644725 | 0.612 | 0.028 | 4.54490564244384e-131 | |
| 4 | Dlx1 | 2.56535220860925e-134 | 2.17453720976991 | 0.535 | 0.013 | 7.96618821339432e-130 | |
| 4 | Dlx6os1 | 2.08661199744732e-128 | 2.03436181273405 | 0.494 | 0.009 | 6.47955623567316e-124 | |
| 4 | Lhx6 | 7.99028101304119e-125 | 2.08947783804412 | 0.476 | 0.008 | 2.48122196297968e-120 | |
| 4 | Gad1 | 3.29461343867272e-95 | 1.50120325823072 | 0.371 | 0.006 | 1.02307631111104e-90 | |
| 4 | Nxph1 | 2.36824001741817e-85 | 1.62918747157671 | 0.347 | 0.008 | 7.35409572608865e-81 | |
| 4 | Meg3 | 2.41454915742348e-84 | 3.42889226567418 | 0.9 | 0.318 | 7.49789949854712e-80 | |
| 5 | Ifi203 | 1.25430673965555e-86 | 0.692929195747845 | 0.41 | 0.012 | 3.89499871865236e-82 | |
| 5 | Mndal | 7.12028871451866e-82 | 0.716941700194033 | 0.52 | 0.031 | 2.21106325451948e-77 | |
| 5 | Tbata | 2.92589722345336e-74 | 0.44862861819836 | 0.29 | 0.004 | 9.08578864798972e-70 | |
| 5 | Lhx9 | 8.6415905710369e-66 | 0.750448349887463 | 0.49 | 0.039 | 2.68347312002409e-61 | |
| 5 | Rerg | 3.53601484685033e-62 | 0.509080363461451 | 0.31 | 0.01 | 1.09803869039243e-57 | |
| 5 | Calb2 | 1.03285393966806e-57 | 1.66003649644597 | 0.58 | 0.071 | 3.20732133885123e-53 | |
| 5 | Kcnk1 | 4.77926712145354e-53 | 0.63658064520642 | 0.39 | 0.031 | 1.48410581922497e-48 | |
| 5 | Neurod1 | 1.52051537652892e-51 | 1.50580613213725 | 0.85 | 0.211 | 4.72165639873525e-47 | |
| 5 | Zfp385b | 1.02868800498464e-49 | 0.262242468861399 | 0.27 | 0.011 | 3.1943848618788e-45 | |
| 5 | Synpr | 6.72636414197107e-47 | 0.539043466977927 | 0.37 | 0.031 | 2.08873785700628e-42 | |
| 6 | Kifc1 | 9.54146825393219e-93 | 0.902956861835436 | 0.629 | 0.032 | 2.96291213689356e-88 | |
| 6 | Kif20a | 1.67344190158692e-77 | 0.634037375598381 | 0.529 | 0.026 | 5.19653913699788e-73 | |
| 6 | Ccna2 | 1.6012499049721e-75 | 1.3803461381724 | 0.829 | 0.087 | 4.97236132990987e-71 | |
| 6 | Birc5 | 4.69624366495543e-74 | 1.89105607101382 | 0.871 | 0.106 | 1.45832454527861e-69 | |
| 6 | Cenpe | 1.10344463193686e-73 | 1.03228254169172 | 0.671 | 0.054 | 3.42652661555354e-69 | |
| 6 | Clspn | 2.49676847604975e-73 | 0.57860368467965 | 0.529 | 0.029 | 7.7532151486773e-69 | |
| 6 | Pclaf | 2.44724688404253e-70 | 2.13680883233737 | 0.929 | 0.135 | 7.59943574901728e-66 | |
| 6 | Spc25 | 3.37294301312655e-70 | 1.61905205572056 | 0.757 | 0.079 | 1.04739999386619e-65 | |
| 6 | Neil3 | 5.54804025654829e-69 | 0.677277435518847 | 0.557 | 0.036 | 1.72283294086594e-64 | |
| 6 | Ska1 | 9.12742478151095e-69 | 0.71666266753773 | 0.571 | 0.039 | 2.8343392174026e-64 | |
| 7 | Alas2 | 1.35697490354565e-188 | 3.45867430836762 | 0.655 | 0.002 | 4.21381416798031e-184 | |
| 7 | Hba-a1 | 1.76870121121501e-151 | 9.66808653789585 | 0.964 | 0.042 | 5.49234787118598e-147 | |
| 7 | Hbb-bt | 4.60013128990868e-151 | 8.60181786798022 | 0.964 | 0.042 | 1.42847876945534e-146 | |
| 7 | Hba-a2 | 3.63252223056914e-142 | 9.5888607015222 | 0.964 | 0.048 | 1.12800712825863e-137 | |
| 7 | Hbb-bs | 9.00623265774082e-61 | 10.0421401496446 | 0.964 | 0.197 | 2.79670542720826e-56 | |
| 7 | Ube2l6 | 3.00804774530557e-46 | 2.11694259927158 | 0.545 | 0.056 | 9.34089066349739e-42 | |
| 7 | Eef1a1 | 2.72149928039077e-35 | -4.29225198716681 | 0.418 | 0.991 | 8.45107171539745e-31 | |
| 7 | Tuba1a | 5.21866203634301e-35 | -5.76391201070184 | 0.2 | 0.991 | 1.62055112214559e-30 | |
| 7 | Rps8 | 6.80830945300702e-35 | -4.11218773216002 | 0.291 | 0.986 | 2.11418433444227e-30 | |
| 7 | Rpl14 | 6.99016586347659e-35 | -4.21665987365811 | 0.091 | 0.981 | 2.17065620558539e-30 | |
| 8 | Lhx1os | 2.55069318254564e-231 | 2.05583231404331 | 0.833 | 0.001 | 7.92066753975897e-227 | |
| 8 | Trp73 | 2.75707815209185e-219 | 1.25519115778562 | 0.833 | 0.002 | 8.56155478569081e-215 | |
| 8 | Gdf5 | 1.72448550097415e-204 | 1.82643448666118 | 0.889 | 0.004 | 5.35504482617502e-200 | |
| 8 | Lhx5 | 7.51894645160276e-197 | 1.77608638744023 | 0.833 | 0.004 | 2.3348584416162e-192 | |
| 8 | Gm27199 | 3.71558550676086e-176 | 1.28588450446607 | 0.611 | 0.001 | 1.15380076741445e-171 | |
| 8 | Ndnf | 5.29402131799917e-157 | 2.1267772838127 | 0.667 | 0.003 | 1.64395243987828e-152 | |
| 8 | Lhx1 | 1.09559812693011e-132 | 1.18291679073065 | 0.611 | 0.004 | 3.40216086355608e-128 | |
| 8 | Mab21l1 | 3.93498530959967e-129 | 1.11888541413184 | 0.5 | 0.001 | 1.22193098818999e-124 | |
| 8 | Barhl2 | 5.17813696134129e-129 | 0.690938215510339 | 0.5 | 0.001 | 1.60796687060531e-124 | |
| 8 | Cacna2d2 | 4.087459648836e-119 | 2.14759725167016 | 0.833 | 0.013 | 1.26927884475304e-114 |
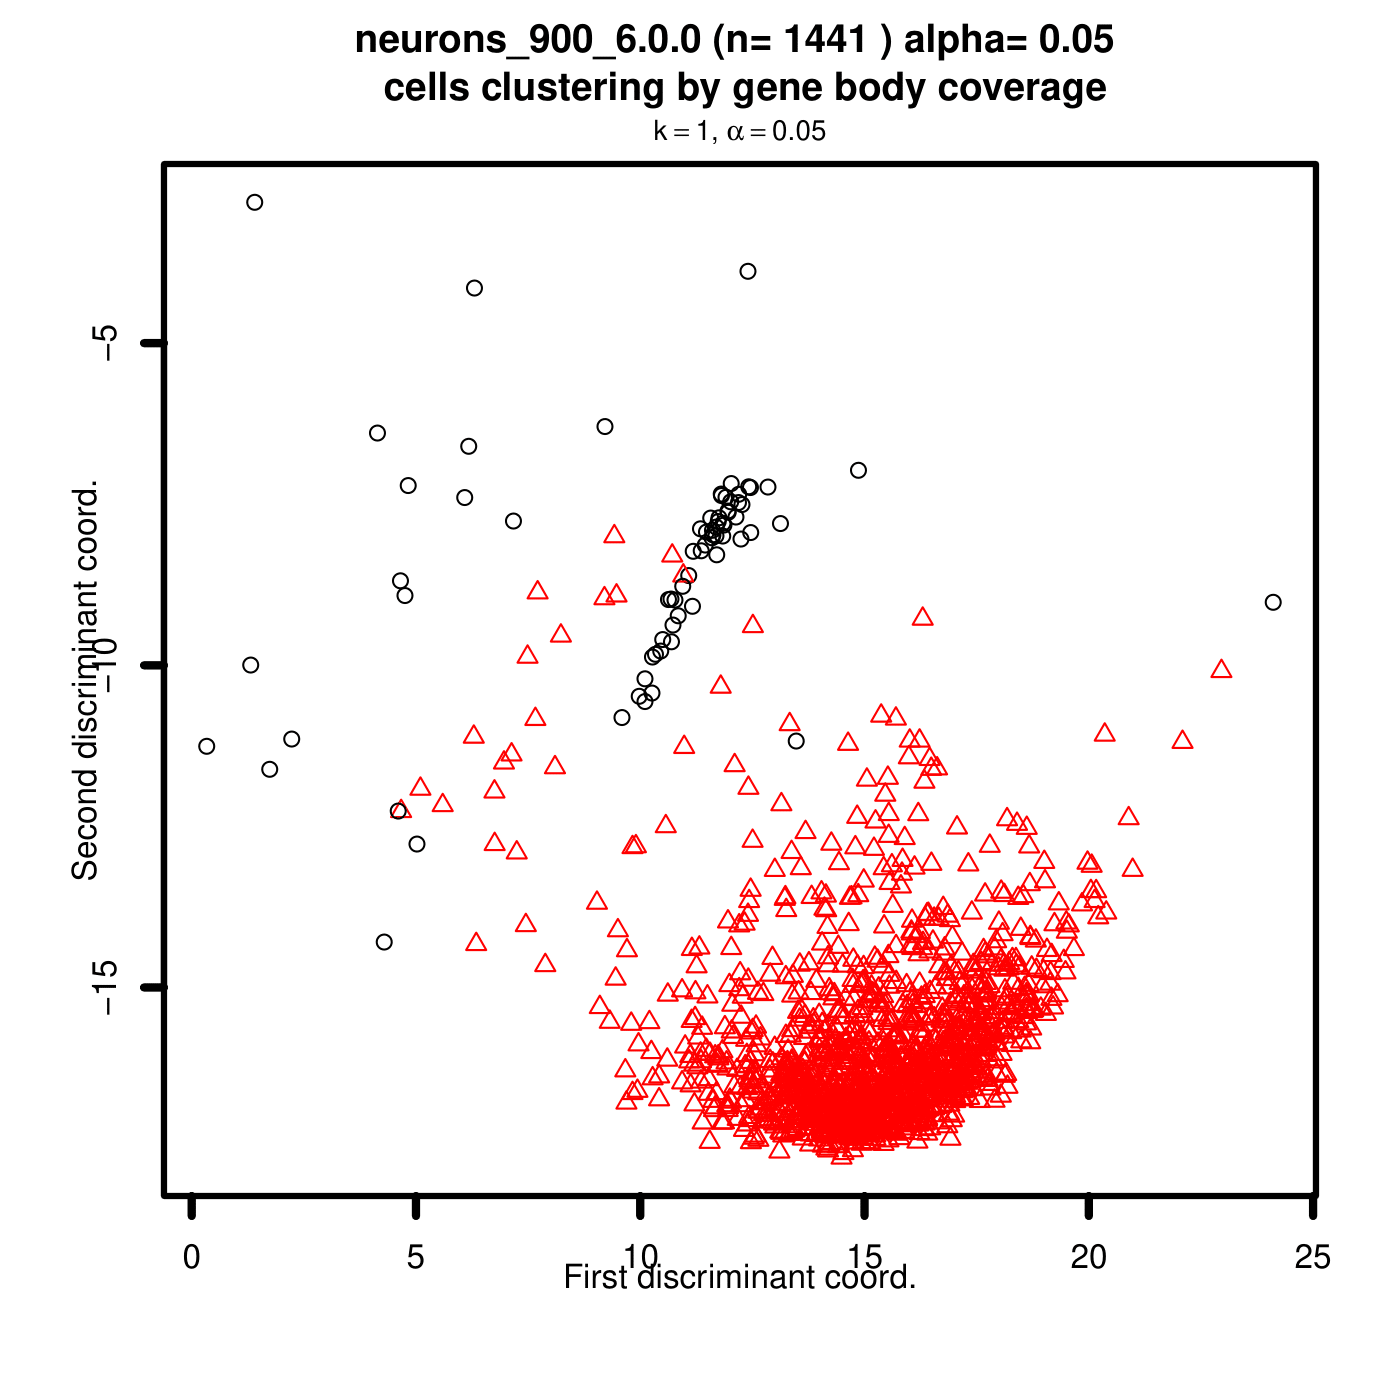
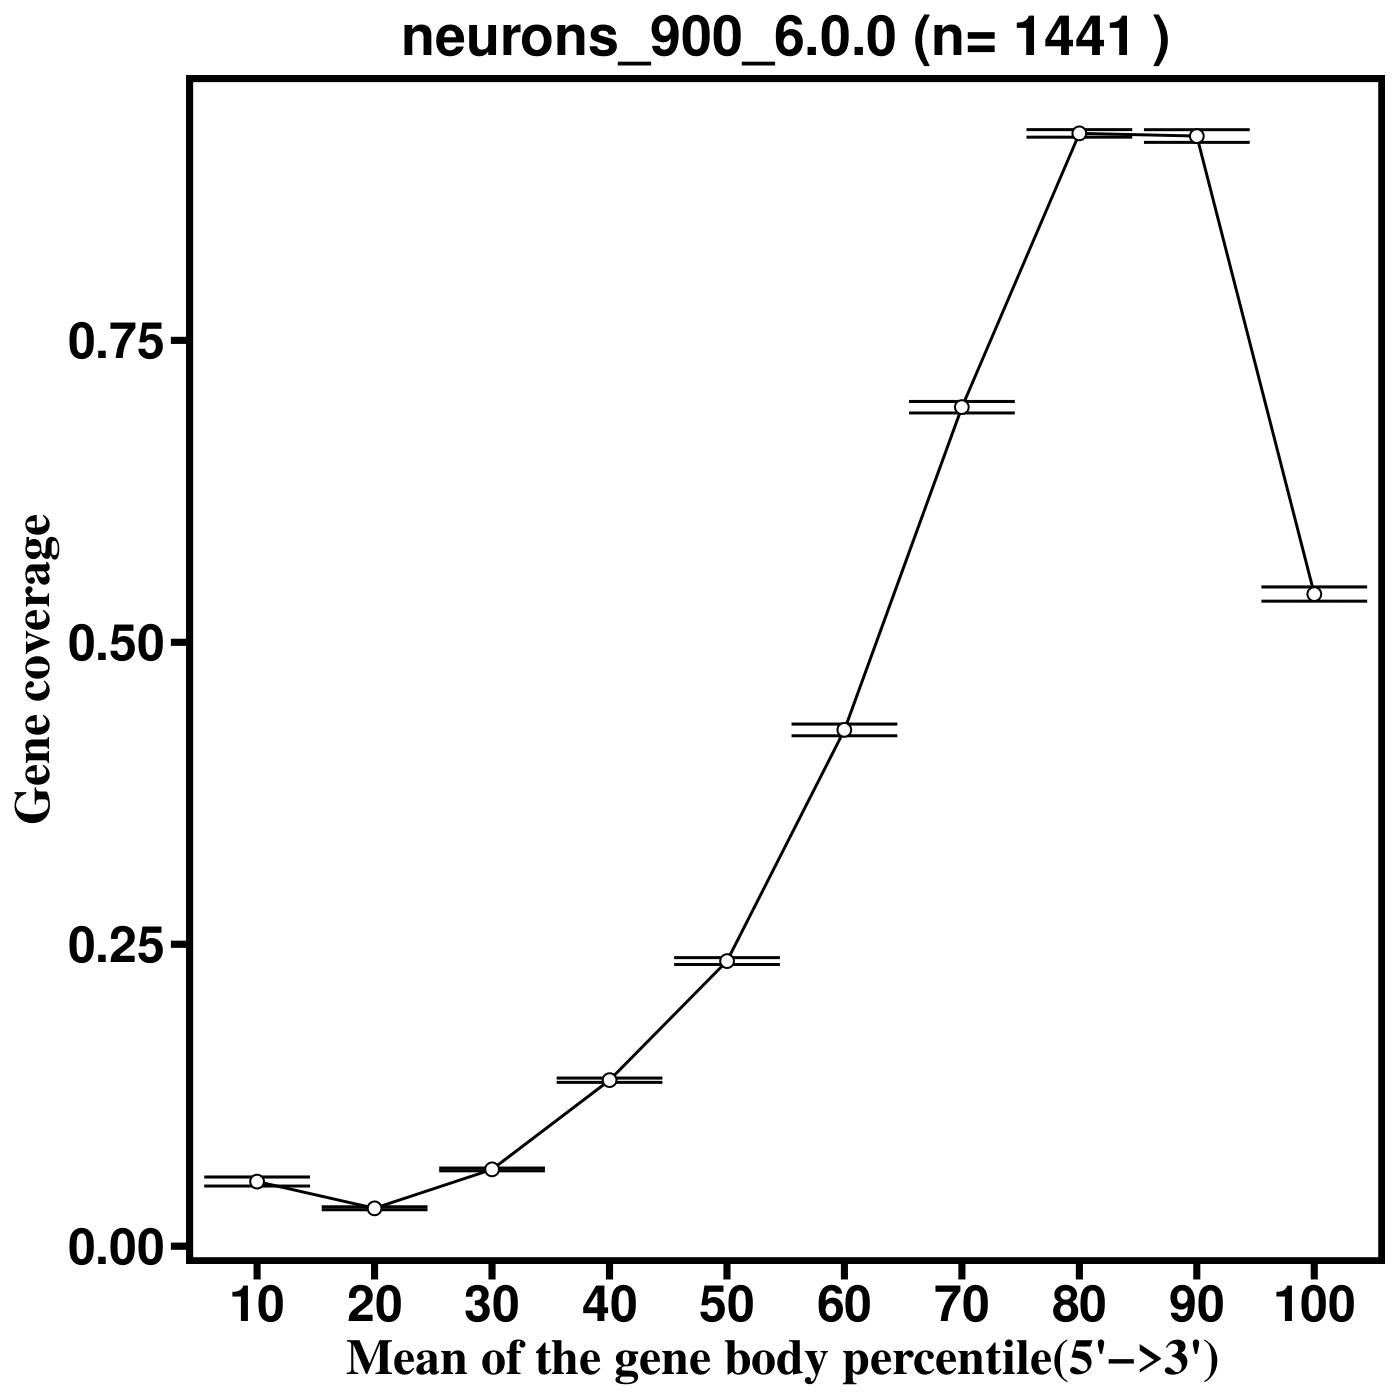
SkewC Quality Control Output Plots
Gene Body Coverage
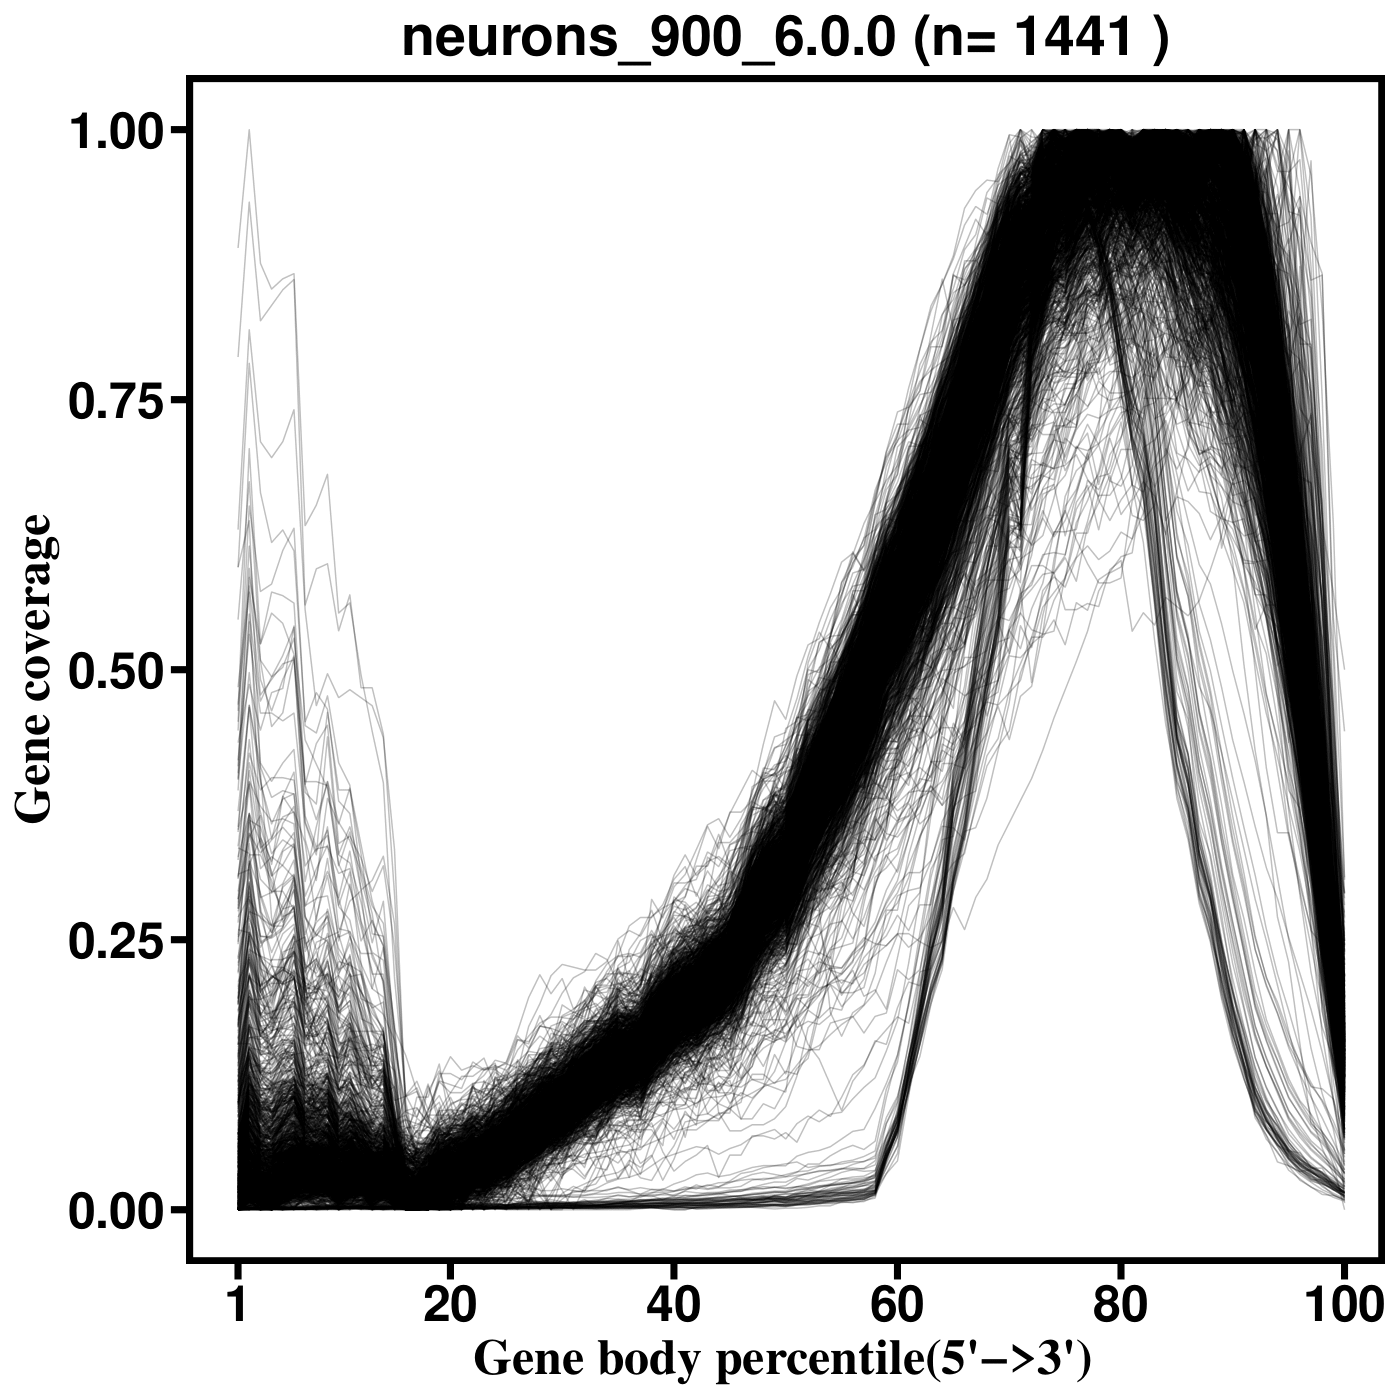
Typical Coverage

Gene Body Coverage of Typical Cells.
Skewed Coverage
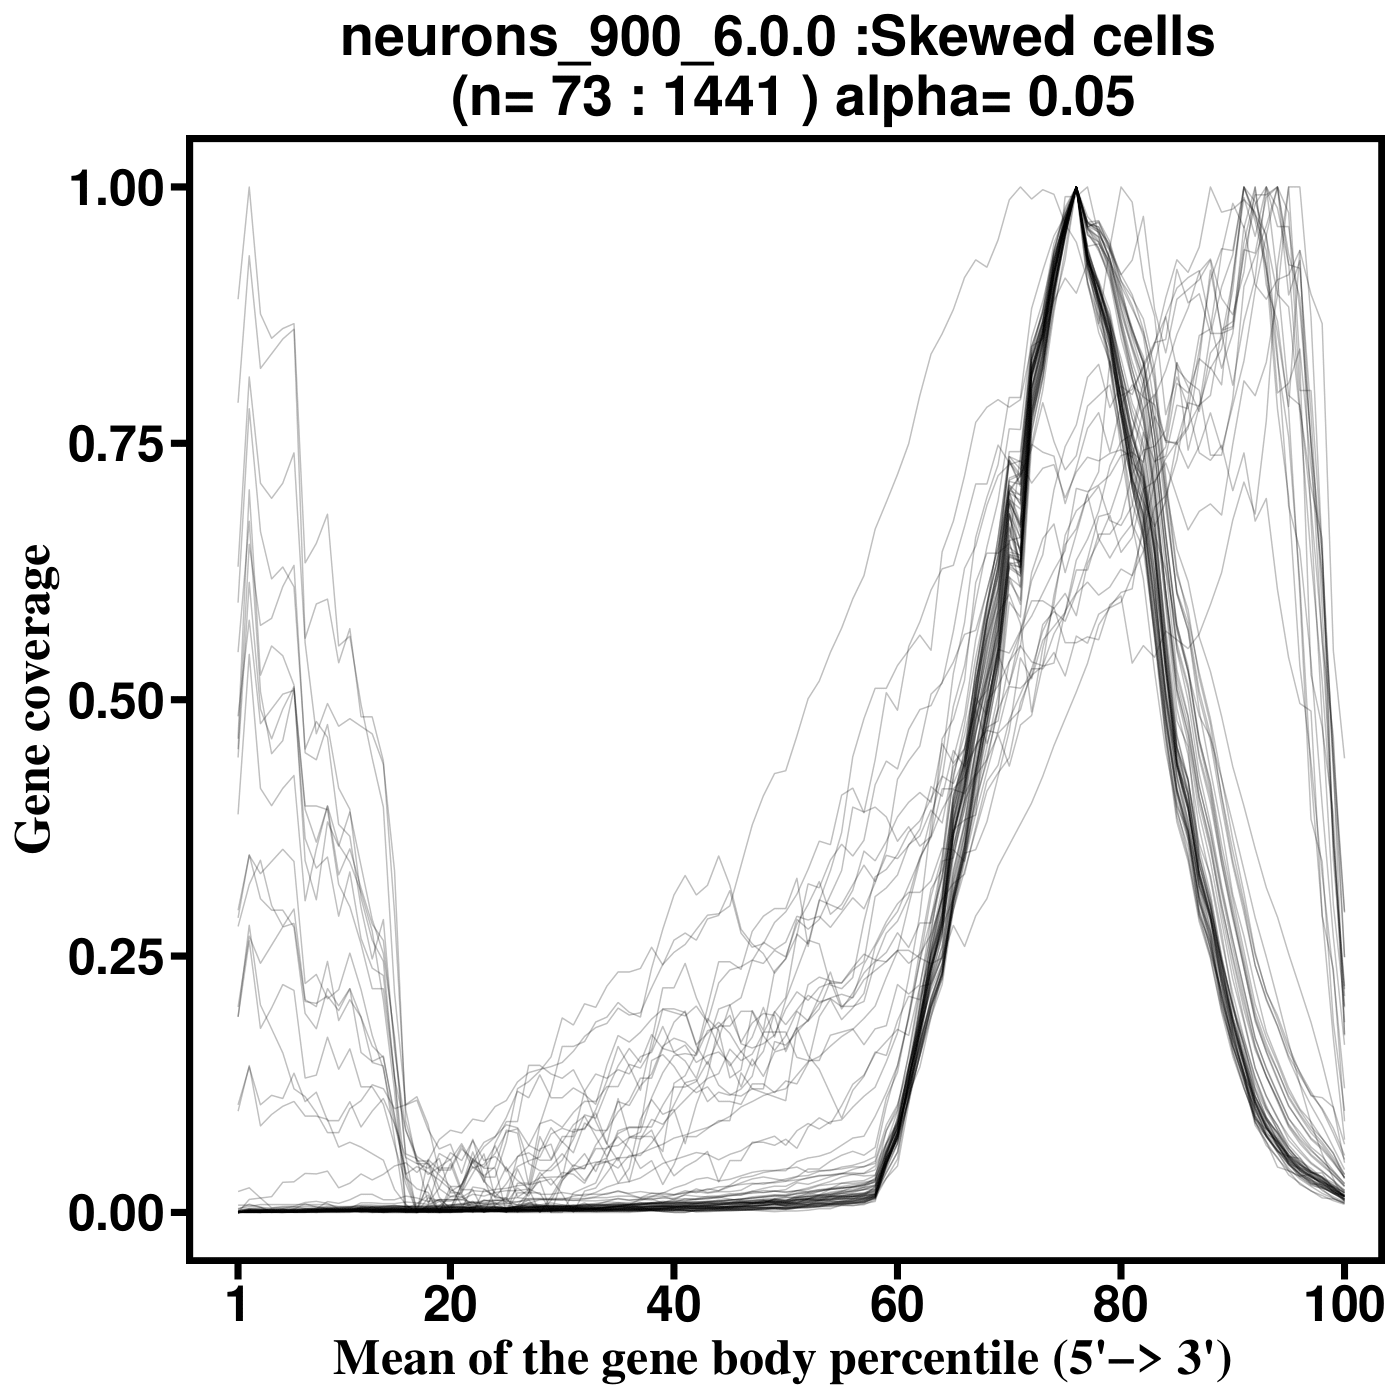
Gene Body Coverage of Skewed Cells.