Single-cell transcriptome analysis revealed continuous changes in molecular phenotypes during epithelial-to-mesenchymal transition
Many genes involved in epithelial-to-mesenchymal transition (EMT) have been identified to date, but mechanisms contributing to the phenotypic diversity and those governing the coupling between the dynamics of epithelial genes and that of the mesenchymal genes are unclear. In this study, we employed single-cell transcriptome analysis to study the gene expression changes during dynamic E-to-M transition. Dose-dependent response to TGFbeta signal suggested that gene expression patterns between E and M states are rather continuous unlike binary switching between two discrete populations. E and M genes can be classified into several subclusters based on expression correlation and it turned out that some E and M genes are mutually exclusive but others are not. Our data suggests that complex and continuous changes in molecular phenotypes occur during EMT at a single-cell level.
CellRanger Metadata
PreviewPreview the Web Summary produced by CellRanger here.
| Accession | Estimated No. of Cells | Mean Reads per Cell | Median Genes per Cell | No. of Reads | % Valid Barcodes | % sequencing Saturation | % Q30 Bases in Barcode | % Q30 Bases in UMI | % Reads Mapped to Genome | % Reads Mapped Confidently to Genome | % Reads Mapped Confidently to Intergenic Regions | % Reads Mapped Confidently to Intronic Regions | % Reads Mapped Confidently to Exonic Regions | % Reads Mapped Confidently to Transcriptome | % Reads Mapped Antisense to Gene | % Fraction Reads in Cells | Total Genes Detected | Median UMI Counts Per Cell |
|---|---|---|---|---|---|---|---|---|---|---|---|---|---|---|---|---|---|---|
| 8832 | 24260 | 2914 | 214264566 | 98.4 | 19.3 | 95.3 | 95.2 | 96.3 | 94.0 | 2.6 | 14.5 | 76.9 | 73.2 | 1.2 | 98.1 | 20300 | 12982 |
Top 10 Marker Genes per Cluster
Download| Accession | Seurat Cluster | Gene Symbol | P Value | Average Log | Pct 1 | Pct 2 | Adjusted P Value |
|---|---|---|---|---|---|---|---|
| 0 | BIRC5 | 1.65430436251077e-112 | 0.401468575574843 | 0.742 | 0.445 | 5.5740131190438e-108 | |
| 0 | CDC20 | 1.44115907342257e-105 | 0.441717957003482 | 0.622 | 0.349 | 4.85584138199e-101 | |
| 0 | CENPW | 2.55026979674645e-101 | 0.36313688179377 | 0.731 | 0.471 | 8.59287905315749e-97 | |
| 0 | CDKN3 | 1.70587427782857e-100 | 0.336901429365047 | 0.629 | 0.356 | 5.7477727917156e-96 | |
| 0 | PHF19 | 1.81055873261563e-91 | 0.332365024361145 | 0.674 | 0.422 | 6.10049659367509e-87 | |
| 1 | DEK | 0 | -1.20202982395726 | 0.521 | 0.885 | 0 | |
| 1 | KIAA0101 | 0 | -1.29786597927266 | 0.415 | 0.931 | 0 | |
| 1 | UBE2S | 0 | -1.73686823409148 | 0.571 | 0.869 | 0 | |
| 1 | CKS1B | 7.21826946536878e-297 | -1.19916927205826 | 0.275 | 0.739 | 2.43212371366136e-292 | |
| 1 | PTTG1 | 1.04221038961543e-280 | -1.01423303326328 | 0.373 | 0.802 | 3.51162368677022e-276 | |
| 1 | BIRC5 | 2.36289798319362e-274 | -0.883125833713129 | 0.072 | 0.596 | 7.96154846457257e-270 | |
| 1 | DTYMK | 1.98358684235746e-261 | -0.818479977783475 | 0.247 | 0.717 | 6.68349750663922e-257 | |
| 1 | CENPW | 7.56012816397535e-246 | -0.749531701665944 | 0.119 | 0.608 | 2.54730958356985e-241 | |
| 1 | SSRP1 | 2.55939274489777e-231 | -0.75126112316415 | 0.471 | 0.827 | 8.62361791465853e-227 | |
| 1 | RPL39L | 1.71797513493674e-224 | -0.818326914358598 | 0.25 | 0.679 | 5.78854541965586e-220 | |
| 2 | MKI67 | 1.65282079973911e-151 | -0.781837224203552 | 0.061 | 0.432 | 5.56901440264097e-147 | |
| 2 | CKS1B | 2.76090801729651e-150 | -0.923350436861346 | 0.436 | 0.701 | 9.30260347347885e-146 | |
| 2 | SMC4 | 1.18376564700753e-127 | -0.785346695704488 | 0.287 | 0.585 | 3.98857997102718e-123 | |
| 2 | CENPF | 1.163983512389e-122 | -0.779651633241231 | 0.095 | 0.42 | 3.92192604664351e-118 | |
| 2 | CDC20 | 1.29019748328066e-116 | -0.667558259157769 | 0.135 | 0.455 | 4.34719140016586e-112 | |
| 2 | HMGB2 | 8.38114515416789e-115 | -0.838227414759978 | 0.177 | 0.472 | 2.82394304824533e-110 | |
| 2 | PRC1 | 7.41839582310662e-111 | -0.490156466537762 | 0.056 | 0.363 | 2.49955428863754e-106 | |
| 2 | TOP2A | 2.20175788762077e-108 | -0.785946094300637 | 0.057 | 0.349 | 7.41860302654942e-104 | |
| 2 | UBE2C | 1.94833637436835e-104 | -0.821325169359801 | 0.076 | 0.363 | 6.56472457979672e-100 | |
| 2 | CCNA2 | 2.98724295529183e-102 | -0.448054410930112 | 0.034 | 0.312 | 1.00652164135603e-97 | |
| 3 | UBE2C | 0 | 1.71106533703224 | 0.956 | 0.224 | 0 | |
| 3 | TOP2A | 0 | 1.70797868578441 | 0.96 | 0.206 | 0 | |
| 3 | CENPF | 0 | 1.37732634206023 | 0.959 | 0.282 | 0 | |
| 3 | KPNA2 | 0 | 1.28914361835429 | 0.951 | 0.457 | 0 | |
| 3 | CKS2 | 0 | 1.19948567516232 | 0.974 | 0.517 | 0 | |
| 3 | MKI67 | 0 | 1.14332497106563 | 0.935 | 0.29 | 0 | |
| 3 | CKS1B | 0 | 1.13682584885657 | 0.981 | 0.612 | 0 | |
| 3 | HMGB2 | 0 | 1.08482516217574 | 0.939 | 0.349 | 0 | |
| 3 | ARL6IP1 | 0 | 1.08016938542862 | 0.946 | 0.545 | 0 | |
| 3 | SMC4 | 0 | 1.06418707975034 | 0.966 | 0.475 | 0 | |
| 4 | CLSPN | 0 | 0.719120010828222 | 0.682 | 0.139 | 0 | |
| 4 | HIST1H4C | 7.12197320784577e-262 | 1.748447929081 | 0.951 | 0.681 | 2.39967765265155e-257 | |
| 4 | HIST1H1A | 1.30223490780688e-235 | 0.477970738828181 | 0.406 | 0.068 | 4.3877502983645e-231 | |
| 4 | E2F1 | 2.14096590966566e-226 | 0.310856033869876 | 0.331 | 0.044 | 7.21377053602747e-222 | |
| 4 | HELLS | 4.15999892199487e-226 | 0.679699803236891 | 0.745 | 0.274 | 1.40167003677695e-221 | |
| 4 | CHAF1A | 5.63254879352081e-219 | 0.505025573762189 | 0.576 | 0.154 | 1.8978309904889e-214 | |
| 4 | TCF19 | 1.66594185265341e-206 | 0.405223623534253 | 0.431 | 0.091 | 5.61322447833041e-202 | |
| 4 | CDC6 | 2.66057403587387e-179 | 0.346818133778734 | 0.395 | 0.084 | 8.96453815647343e-175 | |
| 4 | GINS2 | 5.86227854274146e-171 | 0.485149162519998 | 0.586 | 0.197 | 1.97523613219131e-166 | |
| 4 | USP1 | 9.82102097628523e-161 | 0.529558217129764 | 0.701 | 0.289 | 3.30909480774955e-156 | |
| 5 | C1orf56 | 8.79768284346957e-287 | 1.61591424071047 | 0.828 | 0.339 | 2.96429125727864e-282 | |
| 5 | LRRC75A | 6.96225781117111e-114 | 0.930419466368866 | 0.515 | 0.225 | 2.34586314689599e-109 | |
| 5 | HMGB2 | 2.74284861385254e-49 | -0.374163808430977 | 0.161 | 0.453 | 9.24175411951476e-45 | |
| 5 | FXYD3 | 3.89967435040395e-47 | -0.655593889439966 | 0.182 | 0.463 | 1.31395627562511e-42 | |
| 5 | UPP1 | 6.59783734344741e-39 | -0.333007041149984 | 0.238 | 0.54 | 2.22307531450117e-34 | |
| 5 | BNIP3 | 9.9089954983057e-38 | -0.274488233648673 | 0.311 | 0.643 | 3.33873694319912e-33 | |
| 5 | HIST1H4C | 5.20489892258613e-37 | -0.815676833632081 | 0.44 | 0.739 | 1.75373864297617e-32 | |
| 6 | KRT15 | 0 | 3.57944315857109 | 0.85 | 0.171 | 0 | |
| 6 | AQP3 | 0 | 2.29615344567708 | 0.917 | 0.178 | 0 | |
| 6 | FXYD3 | 0 | 1.73033579913167 | 0.933 | 0.393 | 0 | |
| 6 | S100A9 | 0 | 1.50925051982613 | 0.678 | 0.096 | 0 | |
| 6 | ADIRF | 0 | 1.08426605309142 | 0.817 | 0.174 | 0 | |
| 6 | MAL2 | 0 | 0.676507006770178 | 0.647 | 0.101 | 0 | |
| 6 | CLDN1 | 0 | 0.545163545348529 | 0.489 | 0.053 | 0 | |
| 6 | PMEPA1 | 0 | -2.10804778072546 | 0.427 | 0.958 | 0 | |
| 6 | TPM1 | 0 | -2.24075494475378 | 0.718 | 0.973 | 0 | |
| 6 | FN1 | 0 | -2.6196806941338 | 0.594 | 0.967 | 0 | |
| 7 | MAL2 | 0 | 0.846285763423666 | 0.798 | 0.11 | 0 | |
| 7 | STC2 | 0 | 0.818220167788101 | 0.725 | 0.095 | 0 | |
| 7 | TPM1 | 1.07090880724732e-217 | -2.39286404689461 | 0.712 | 0.965 | 3.60832013513912e-213 | |
| 7 | FN1 | 6.65760374632731e-216 | -2.95725655330677 | 0.633 | 0.953 | 2.24321300628753e-211 | |
| 7 | AQP3 | 2.11886463301675e-213 | 1.13709487767117 | 0.815 | 0.207 | 7.13930249448663e-209 | |
| 7 | PSAT1 | 2.26044948189373e-213 | 0.856663274986604 | 0.82 | 0.224 | 7.61635848429272e-209 | |
| 7 | PMEPA1 | 2.54132480088434e-213 | -2.12404489497542 | 0.501 | 0.937 | 8.56273978409969e-209 | |
| 7 | CLDN1 | 1.5499458732638e-203 | 0.418643204702472 | 0.486 | 0.066 | 5.22238762537506e-199 | |
| 7 | FAM84B | 1.28672135893807e-198 | 0.476671385329913 | 0.556 | 0.093 | 4.33547894680595e-194 | |
| 7 | KRT14 | 1.84314617292109e-192 | -2.66246120453974 | 0.363 | 0.898 | 6.21029671504031e-188 |
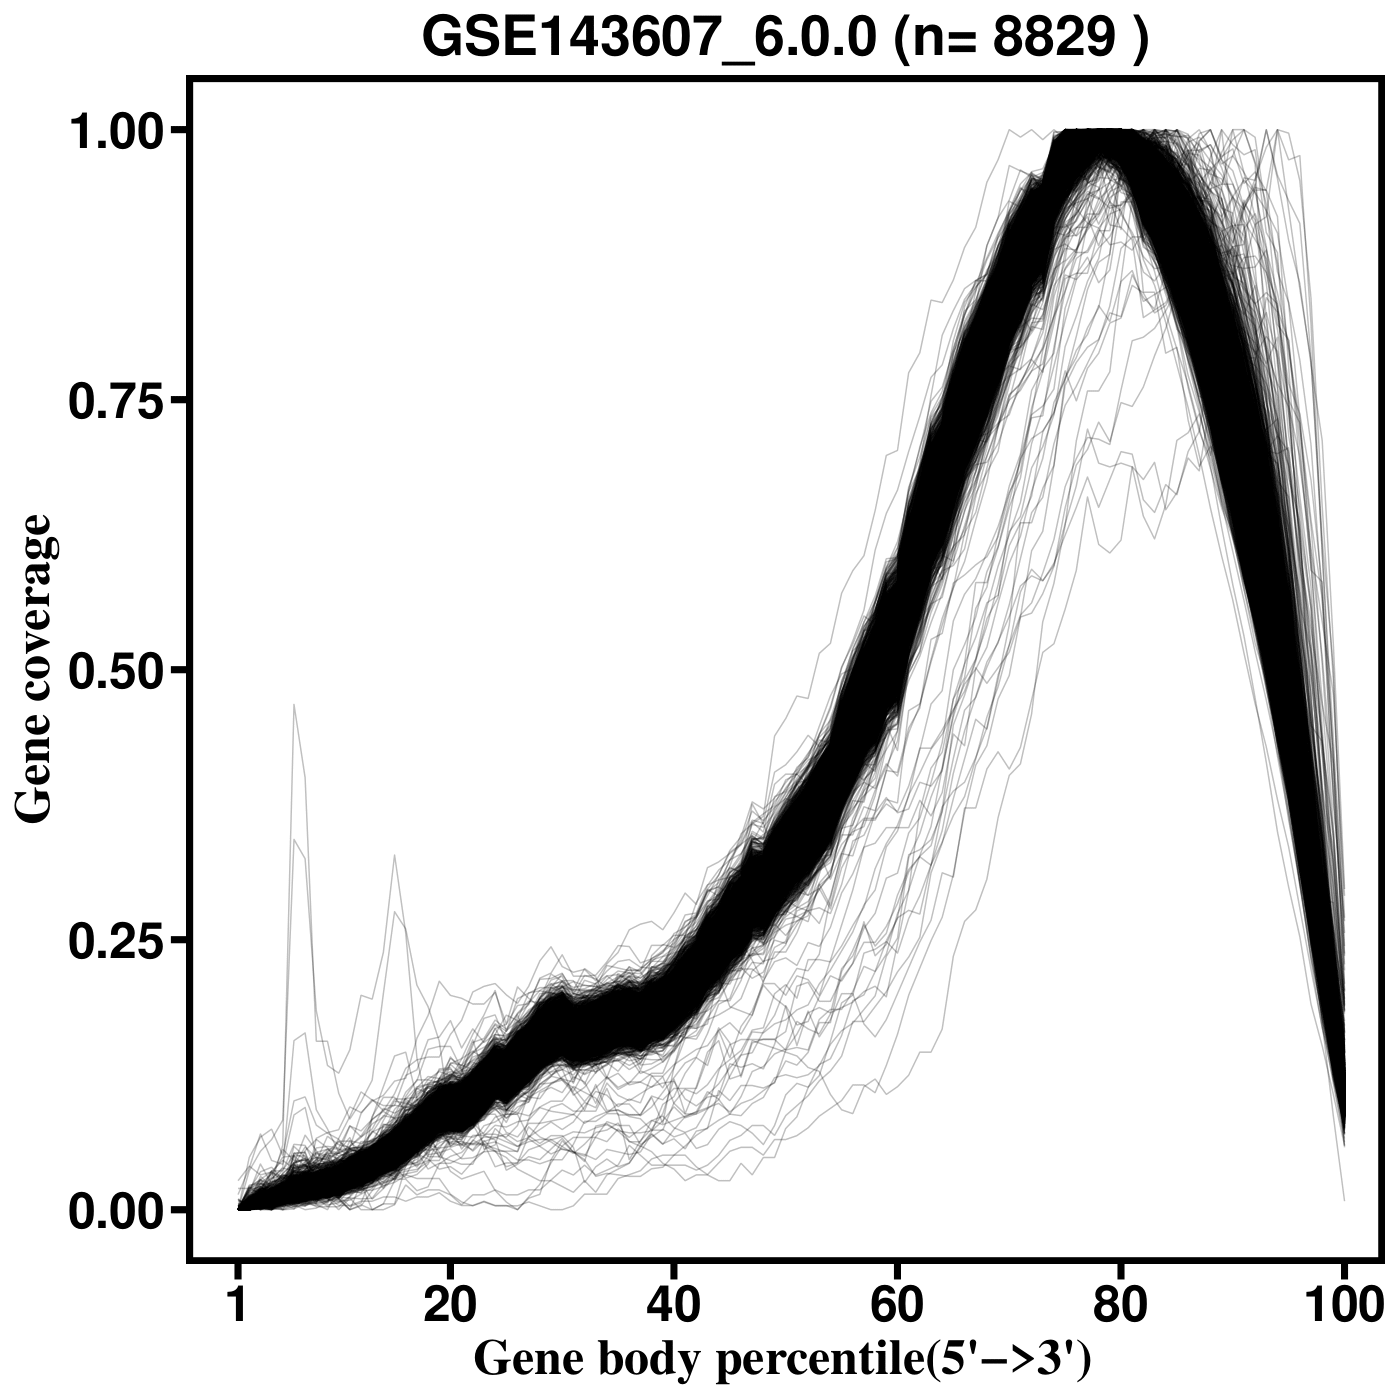
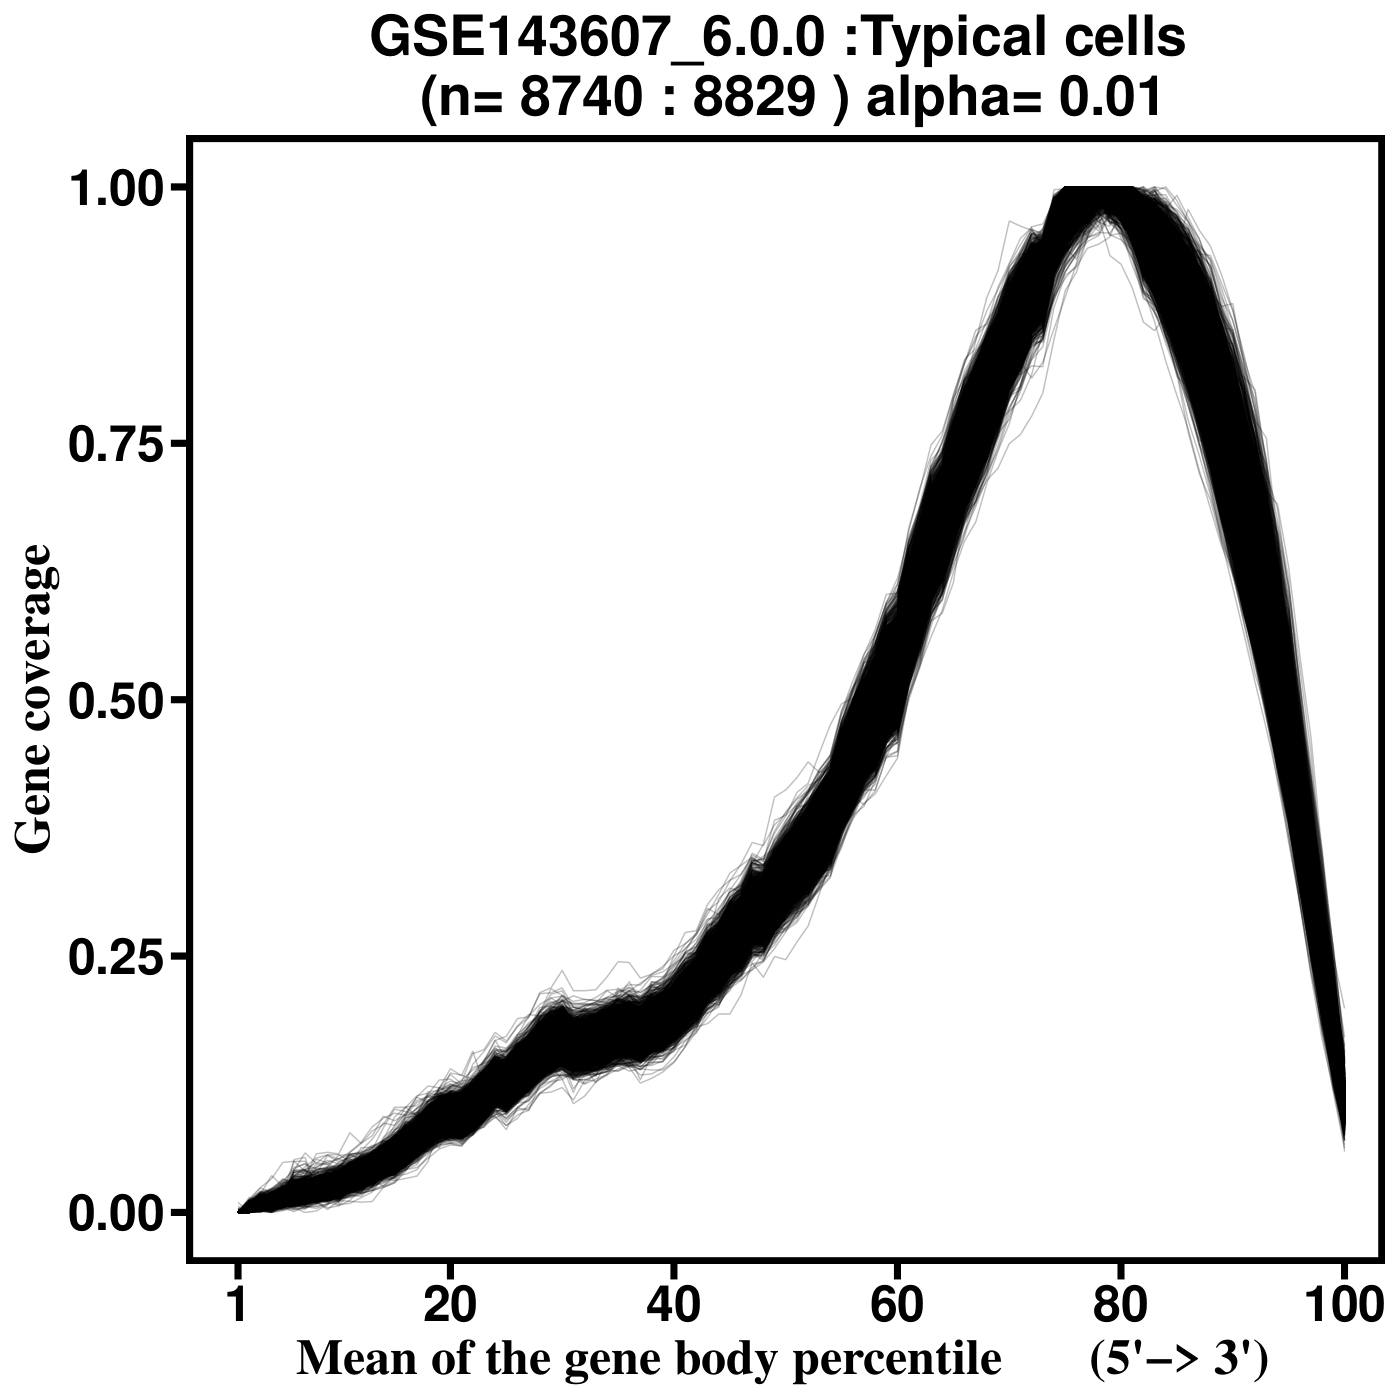
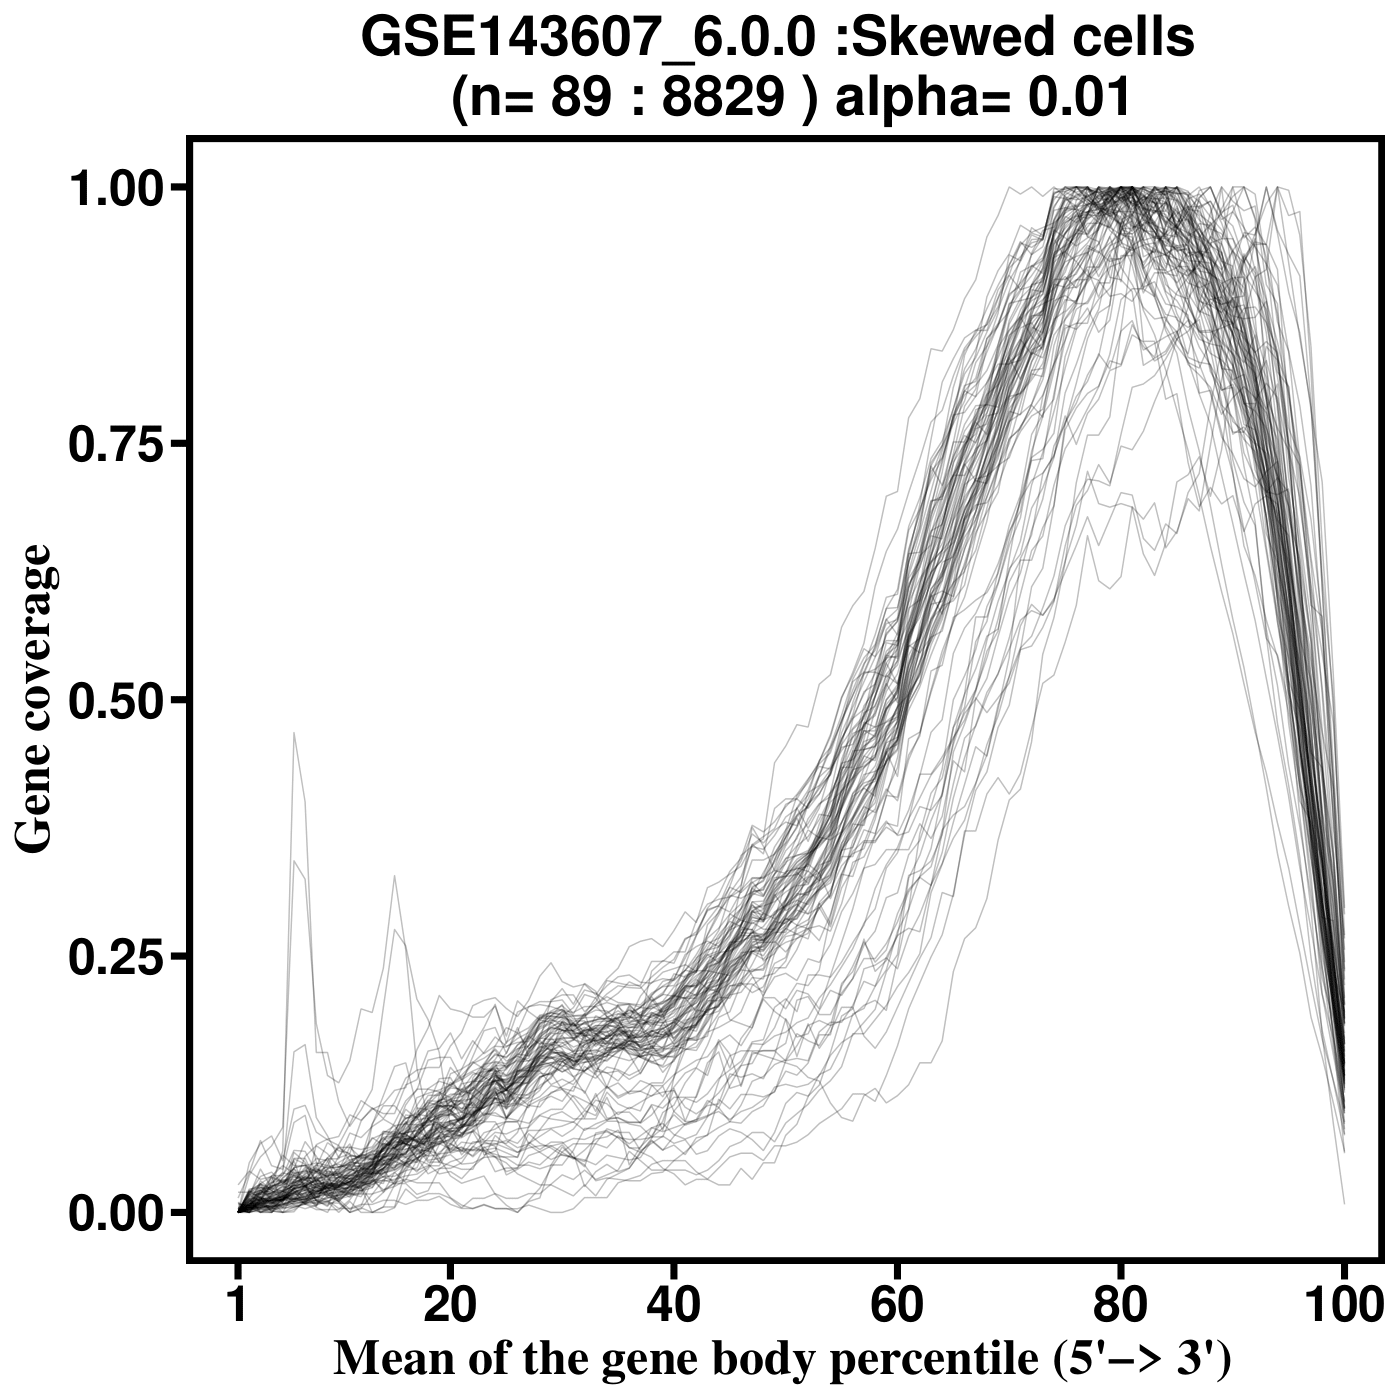
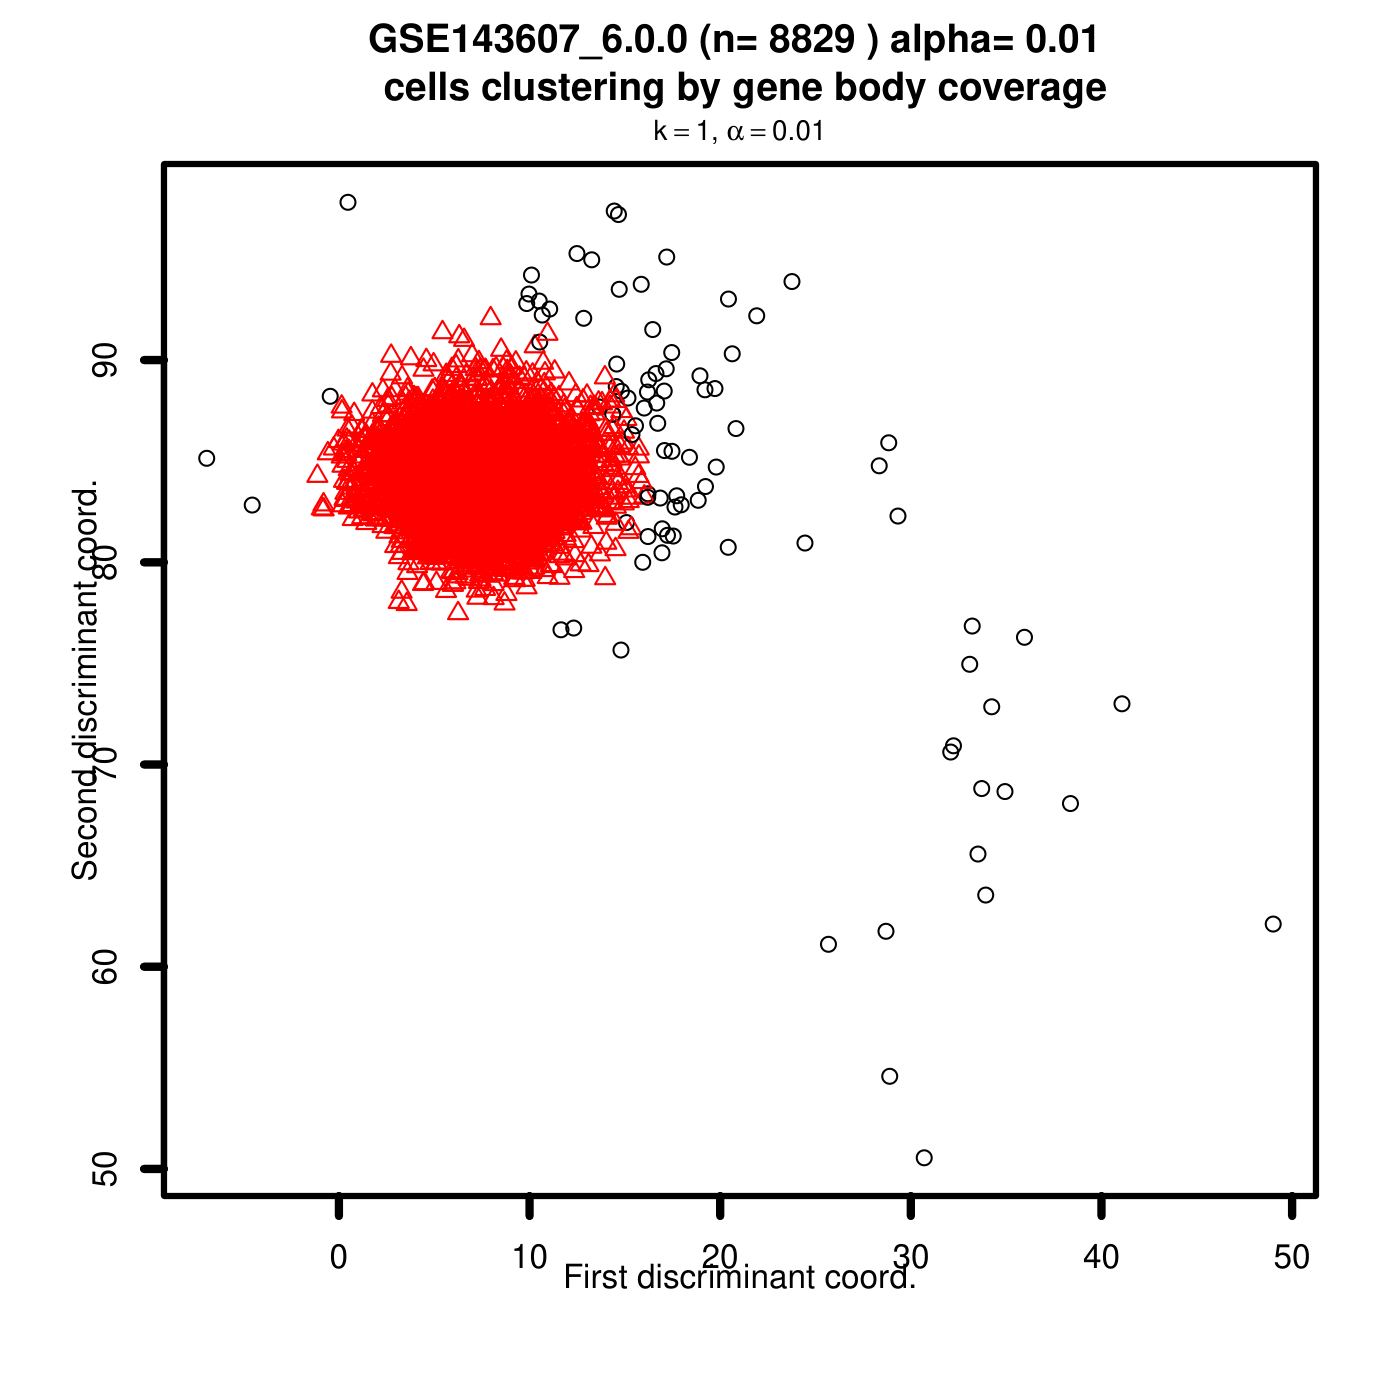
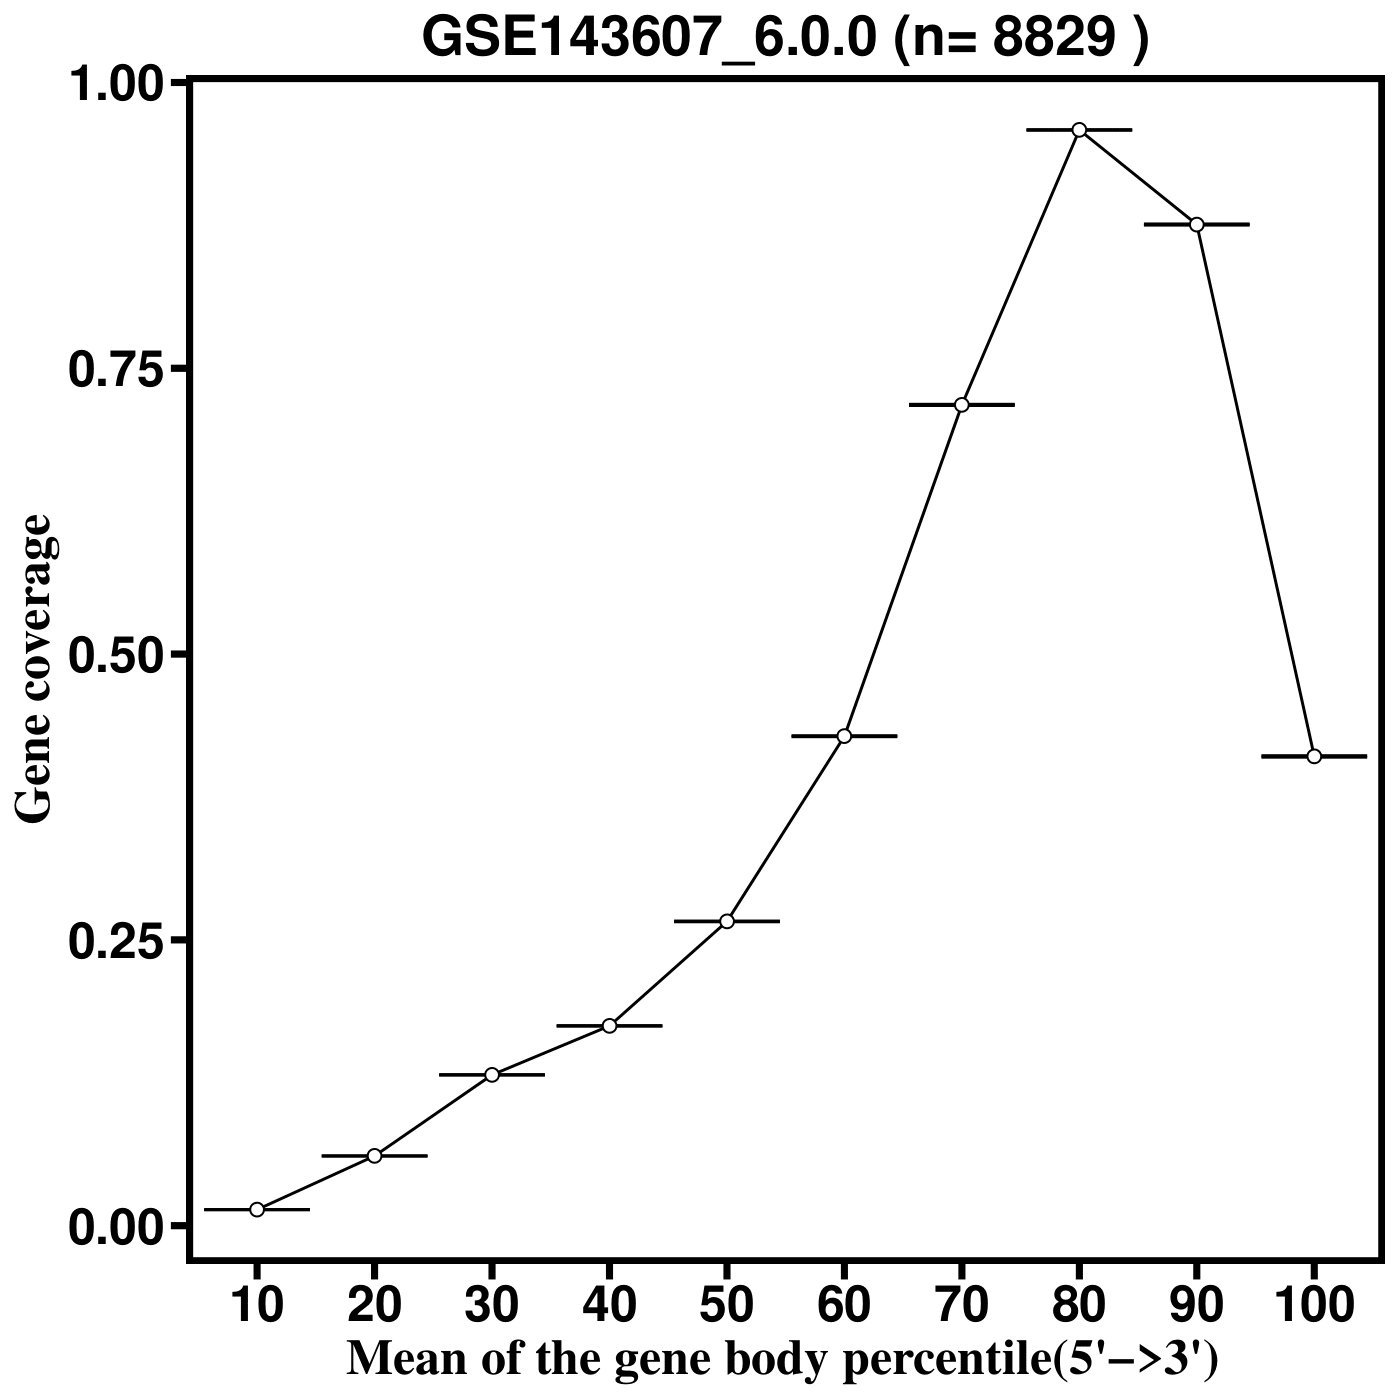
SkewC Quality Control Output Plots
Gene Body Coverage